Visualizations
A very large number of tools exist to make data come to life through visualizations. We make heavy use of the best of them all: d3.js and its multiple derivatives.
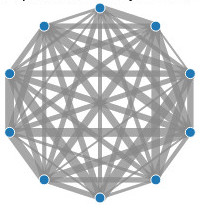
D3 is very lightweight (~150kB), has a simple and elegant syntax, builds directly on web standards such as HTML,CSS and SVG and can solve practically any visualization task, see some examples below:
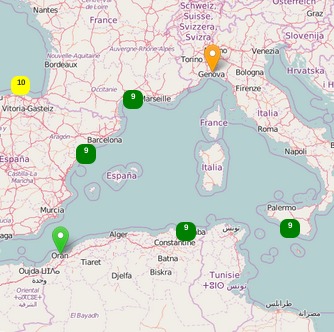 Geographical drill-down (D3 + dc + leaflet)
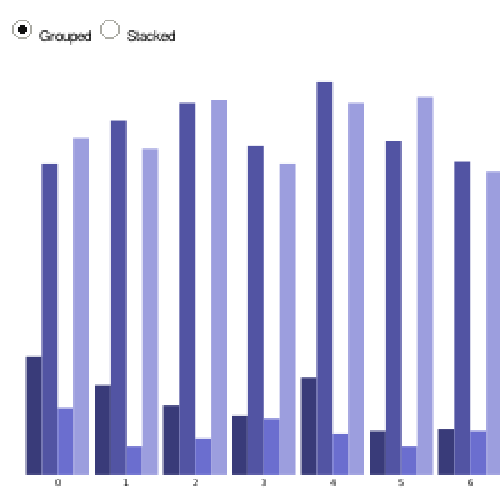 Animated bar chart
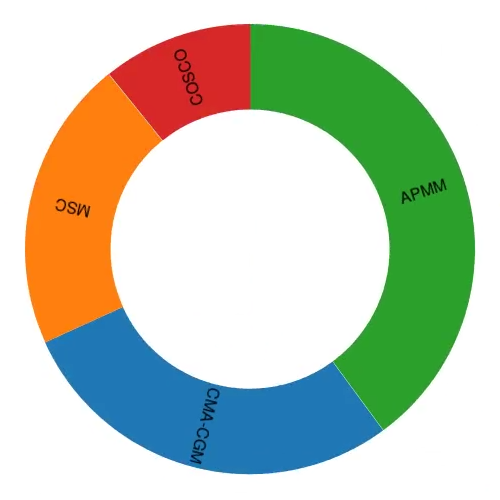 Animated data